Bottom of Funnel Content Marketing: Why Smart Blogs Write BOFU Content First and How To Build a Revenue-Per-Post Machine
TL;DR
One bottom-of-funnel blog post can generate more revenue than 20 top-of-funnel posts combined, yet the average blog publishes 80% TOFU content and wonders why traffic never converts. BOFU content converts at 5-15% compared to 0.5-2% for TOFU, and CXL’s research shows it drives 3-5x more qualified leads per 1,000 pageviews. This is the complete framework for identifying BOFU keywords, prioritizing BOFU content from day one, and projecting revenue per post before you write a single word.
In This Post You’ll Learn
- Why 80% of blog content generates almost zero revenue (and the math behind it)
- The BOFU-first content framework that flips the traditional strategy upside down
- Exact keyword patterns that signal bottom-of-funnel buying intent
- How to calculate revenue per post before you publish
- A step-by-step process for reverse-engineering competitor BOFU content
- The action plan for your first 5 BOFU posts
The 80 Percent Problem: Most Blogs Are Building the Funnel Backwards
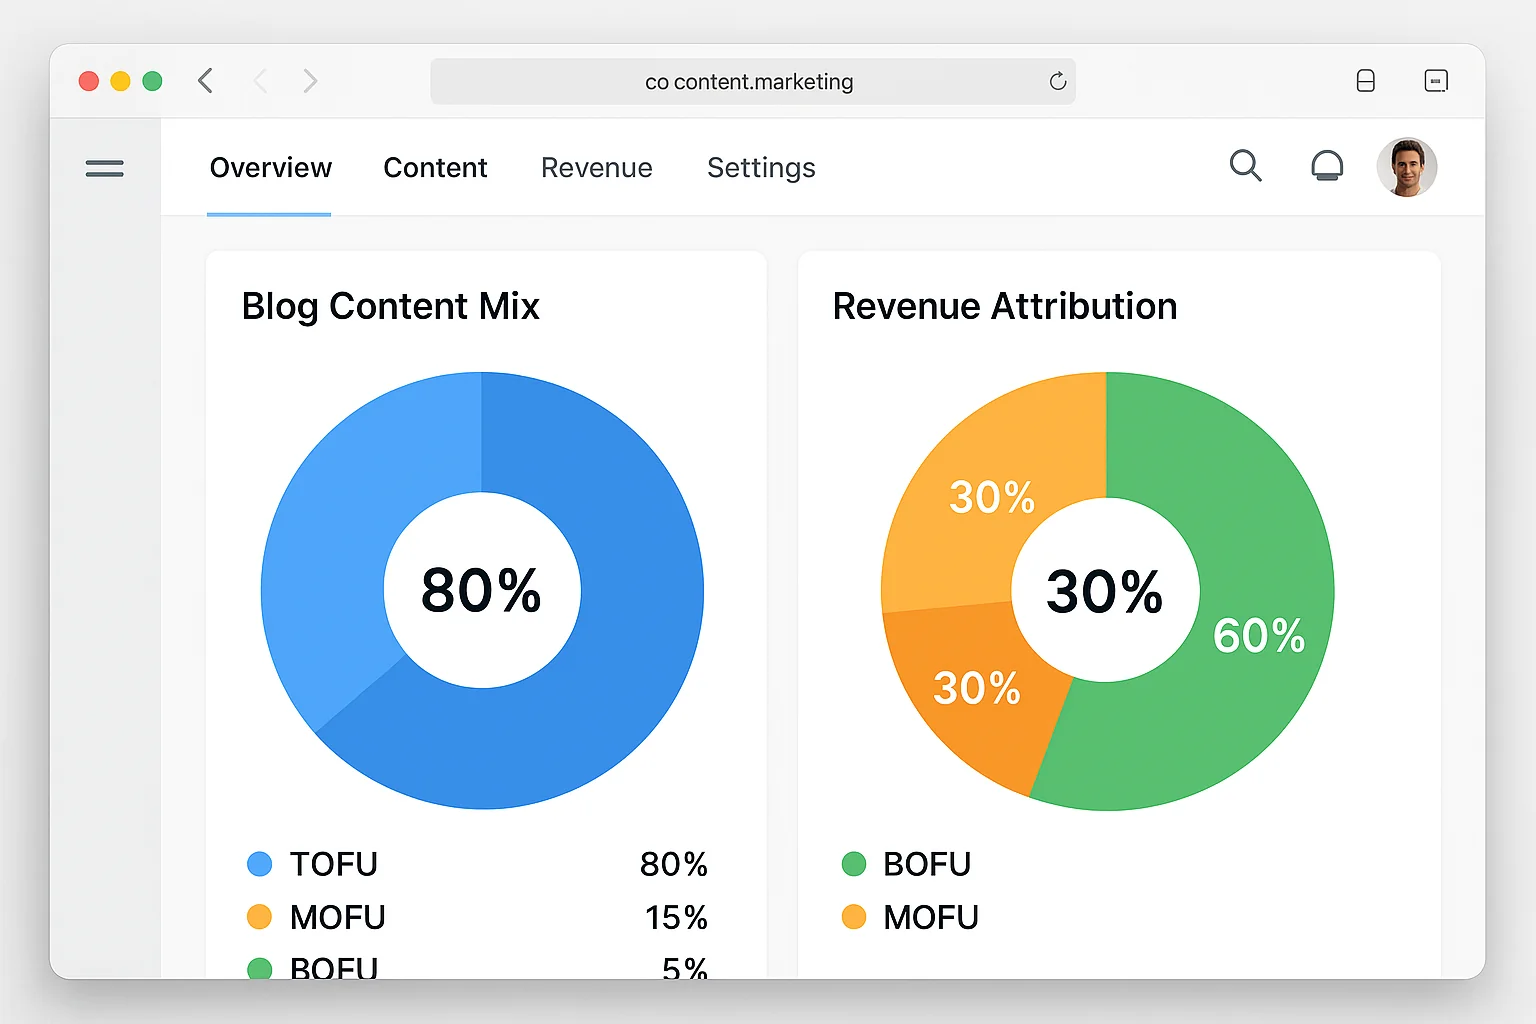
Here’s a number that should make every content marketer uncomfortable: the average blog publishes 80% top-of-funnel content.
“What is [concept].” “Beginner’s guide to [topic].” “10 reasons why [thing] matters.”
That content generates traffic. Sometimes lots of it. And almost none of it converts.
Top-of-funnel content converts at 0.5-2%. That means for every 1,000 visitors your “Ultimate Guide to Content Marketing” attracts, you get 5-20 leads. Most of those leads are researchers, students, or people who are months away from a buying decision.
Bottom-of-funnel content converts at 5-15%. Same 1,000 visitors, but now you are getting 50-150 leads. And these leads are not browsing. They are comparing options, checking pricing, and looking for the solution that solves their specific problem RIGHT NOW.
CXL’s research confirmed this gap is not just about conversion rates. BOFU content drives 3-5x more qualified leads per 1,000 pageviews than TOFU content. The visitors are different. Their intent is different. Their timeline is different.
And yet, most blogs build the funnel from the top down. They spend months publishing awareness content, then wonder why 50,000 monthly visitors produce 12 conversions.
The traffic was never the problem. The content stage was the problem.
The takeaway: An 80/20 split toward TOFU content means 80% of your content budget is producing less than 20% of your revenue. The math does not work. Flip the priority.
The BOFU-First Framework: Start at the Bottom, Work Up
Traditional content strategy says build awareness first. Attract eyeballs. Fill the top of the funnel. Then (eventually, maybe, someday) write bottom-of-funnel content to convert.
That sequence is backwards for any blog that needs revenue within 12 months. Here’s the framework that works.
Phase 1: Publish BOFU Content First (Months 1-3)
Your first 10-15 blog posts should ALL be bottom-of-funnel. Every single one.
These are posts targeting people who already know what they need and are actively deciding which solution to pick. Comparison posts. Alternative roundups. Pricing breakdowns.
The traffic will be low. A BOFU post targeting “best CRM for real estate agents” might get 200 monthly searches. A TOFU post targeting “what is a CRM” gets 15,000.
But those 200 visitors convert at 10-15%. That is 20-30 leads per month from a single post. Meanwhile, your competitor’s “what is a CRM” post with 15,000 visitors converts at 0.8%, producing 120 leads who are nowhere near a buying decision.
Your 200-visitor BOFU post generates more revenue than their 15,000-visitor TOFU post. And it cost a fraction of the effort to rank for.
Phase 2: Add MOFU Content (Months 3-6)
Once your BOFU foundation is live, add middle-of-funnel content that funnels readers down into your existing BOFU posts. How-to guides. Framework breakdowns. Process explanations. Every MOFU post should internally link to at least 2-3 of your BOFU posts.
Phase 3: Layer TOFU on Top (Months 6+)
Now (and only now) add top-of-funnel awareness content. By this point, you have a conversion engine at the bottom. Every TOFU visitor who enters your ecosystem has BOFU content waiting for them at the end of the journey.
The BOFU-first framework ensures you never scramble to convert traffic. The conversion layer exists before the traffic arrives.
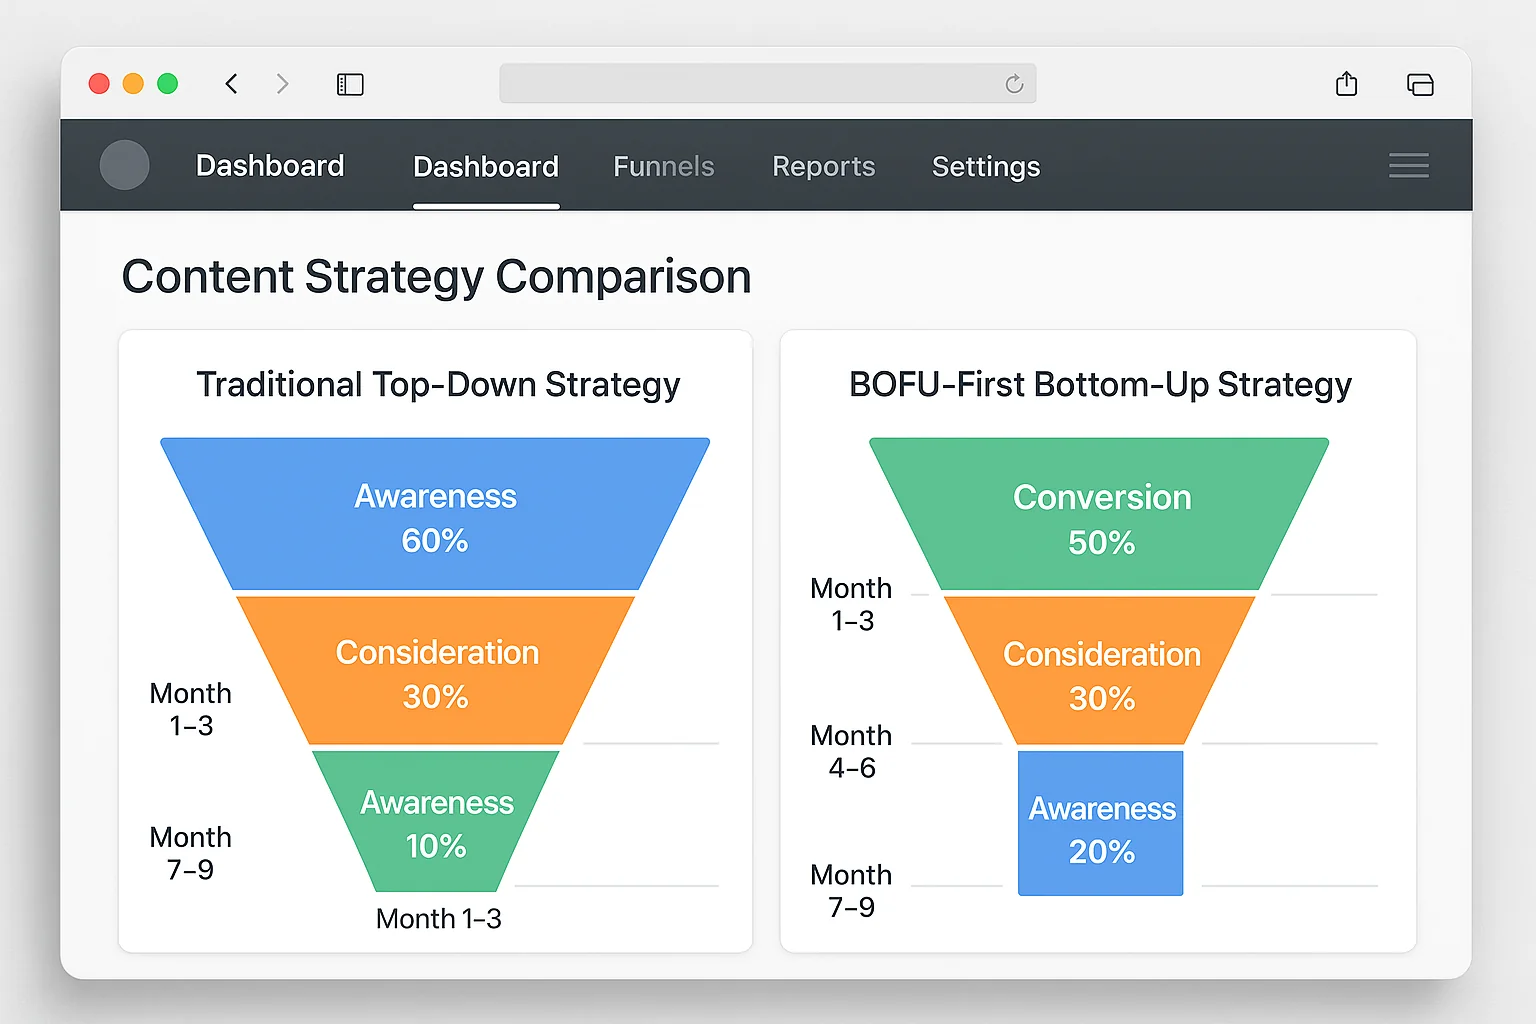
The takeaway: Start at the bottom, not the top. Your first 10-15 posts should target buyers, not browsers. Low traffic, high conversion. Then build upward.
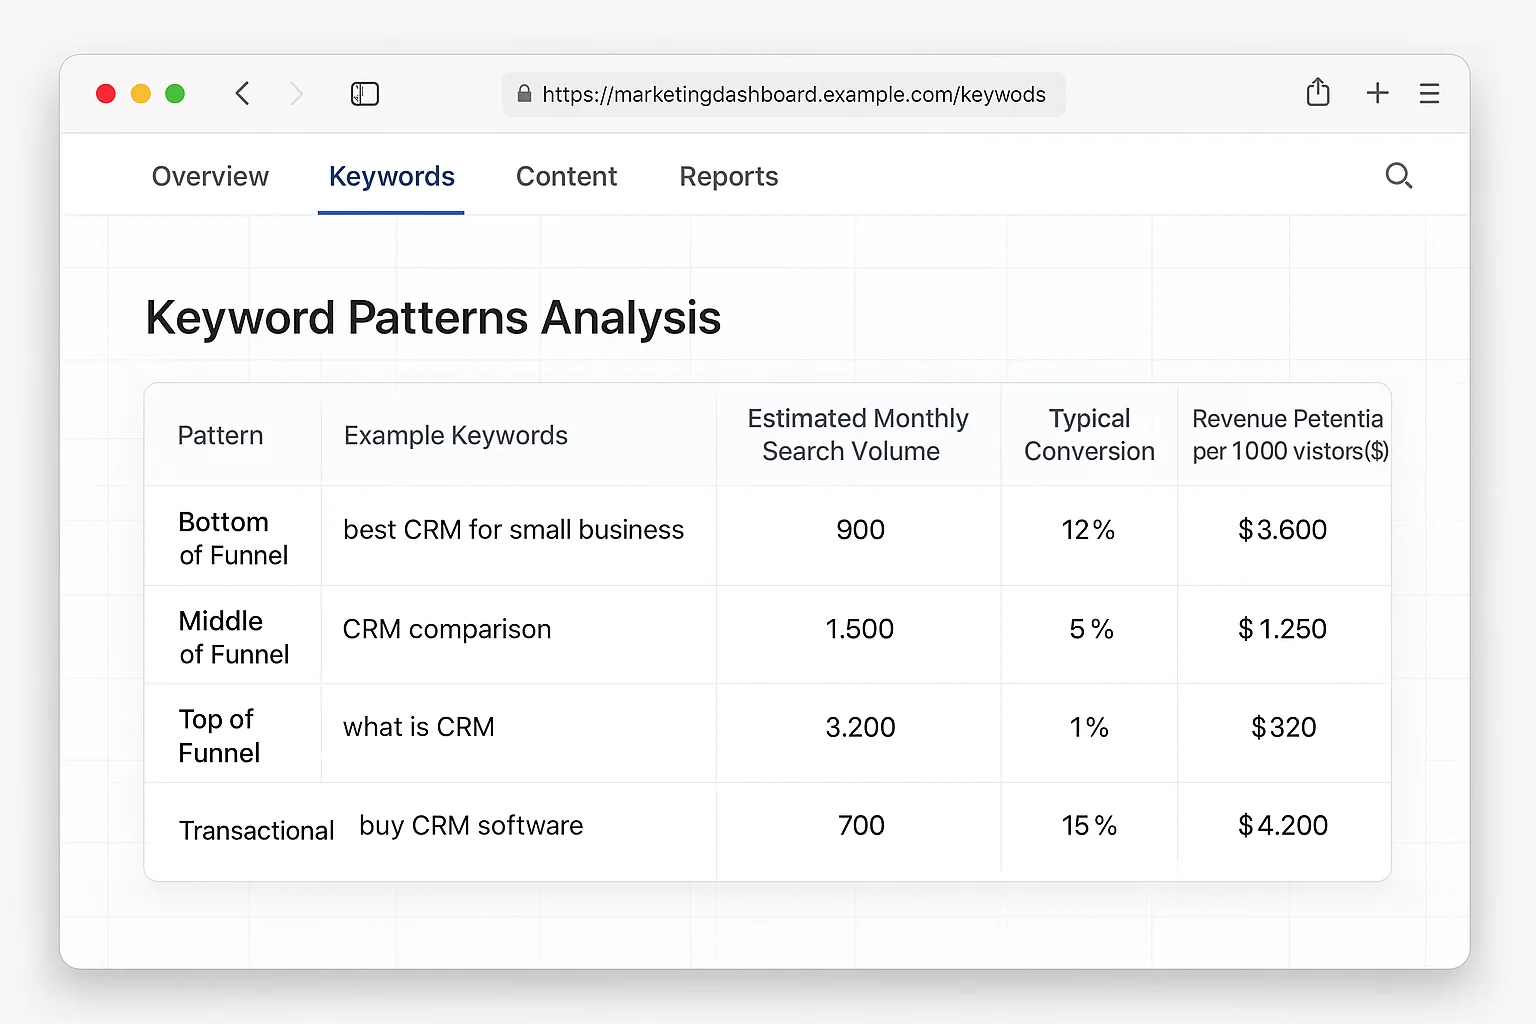
The 4 Keyword Patterns That Signal Buying Intent
Not all BOFU keywords look the same. But they follow predictable patterns. Once you see them, you can identify bottom-of-funnel opportunities in any niche in minutes.
Pattern 1: “Best [Tool/Product] for [Specific Use Case]”
Examples: “best project management tool for agencies,” “best email marketing platform for ecommerce,” “best CRM for solopreneurs.”
This is the HIGHEST intent keyword pattern in content marketing. The searcher has already decided they need a tool and narrowed it to a category. They are looking for the best fit for their specific situation.
These posts convert at 8-15%. Wirecutter built a billion-dollar media company largely on this keyword pattern.
Pattern 2: “[Tool A] vs [Tool B]”
Examples: “HubSpot vs Salesforce,” “Mailchimp vs ConvertKit,” “Notion vs Asana.”
The searcher has narrowed their options to two finalists. They are READY to buy. They just need the nudge.
Comparison posts convert at 5-12% because the reader has already done their research. Your job is to help them pick the winner.
Pattern 3: “[Tool/Product] Pricing” or “[Tool/Product] Cost”
Examples: “HubSpot pricing 2026,” “Shopify monthly cost,” “Salesforce per user pricing.”
Pricing searches are the clearest buying signal in SEO. Nobody researches pricing for something they are not seriously considering purchasing.
Pricing posts convert at 10-15%+ because the reader is evaluating whether they can afford to buy. Give them the breakdown, add context about value, and watch the conversions roll in.
Pattern 4: “How to [Solve a Specific Problem]”
Examples: “how to set up email automation in Klaviyo,” “how to migrate from WordPress to Webflow,” “how to reduce Shopify cart abandonment.”
This pattern is different from TOFU “how to” content. The difference is specificity. “How to do email marketing” is TOFU. “How to set up abandoned cart emails in Klaviyo” is BOFU. The searcher has already chosen the platform.
These posts convert at 5-10% because the reader already owns (or is about to buy) the product.
How to Find These Keywords in Under 15 Minutes
Open Google Keyword Planner or any keyword research tool. Type in your niche. Filter using these modifiers:
- “best” + your category (Pattern 1)
- Your top competitor name + “vs” (Pattern 2)
- Your product or competitor + “pricing” (Pattern 3)
- “how to” + specific action + specific tool (Pattern 4)
Sort by search volume. Ignore anything above 5,000 monthly searches (probably TOFU). Focus on the 100-2,000 range. That is the BOFU sweet spot: low competition, meaningful volume, loaded with buying intent.
The takeaway: BOFU keywords follow 4 predictable patterns. “Best for,” “vs,” “pricing,” and specific “how to.” Find them using keyword modifiers, target the 100-2,000 monthly search volume range, and prioritize by conversion potential over traffic volume.
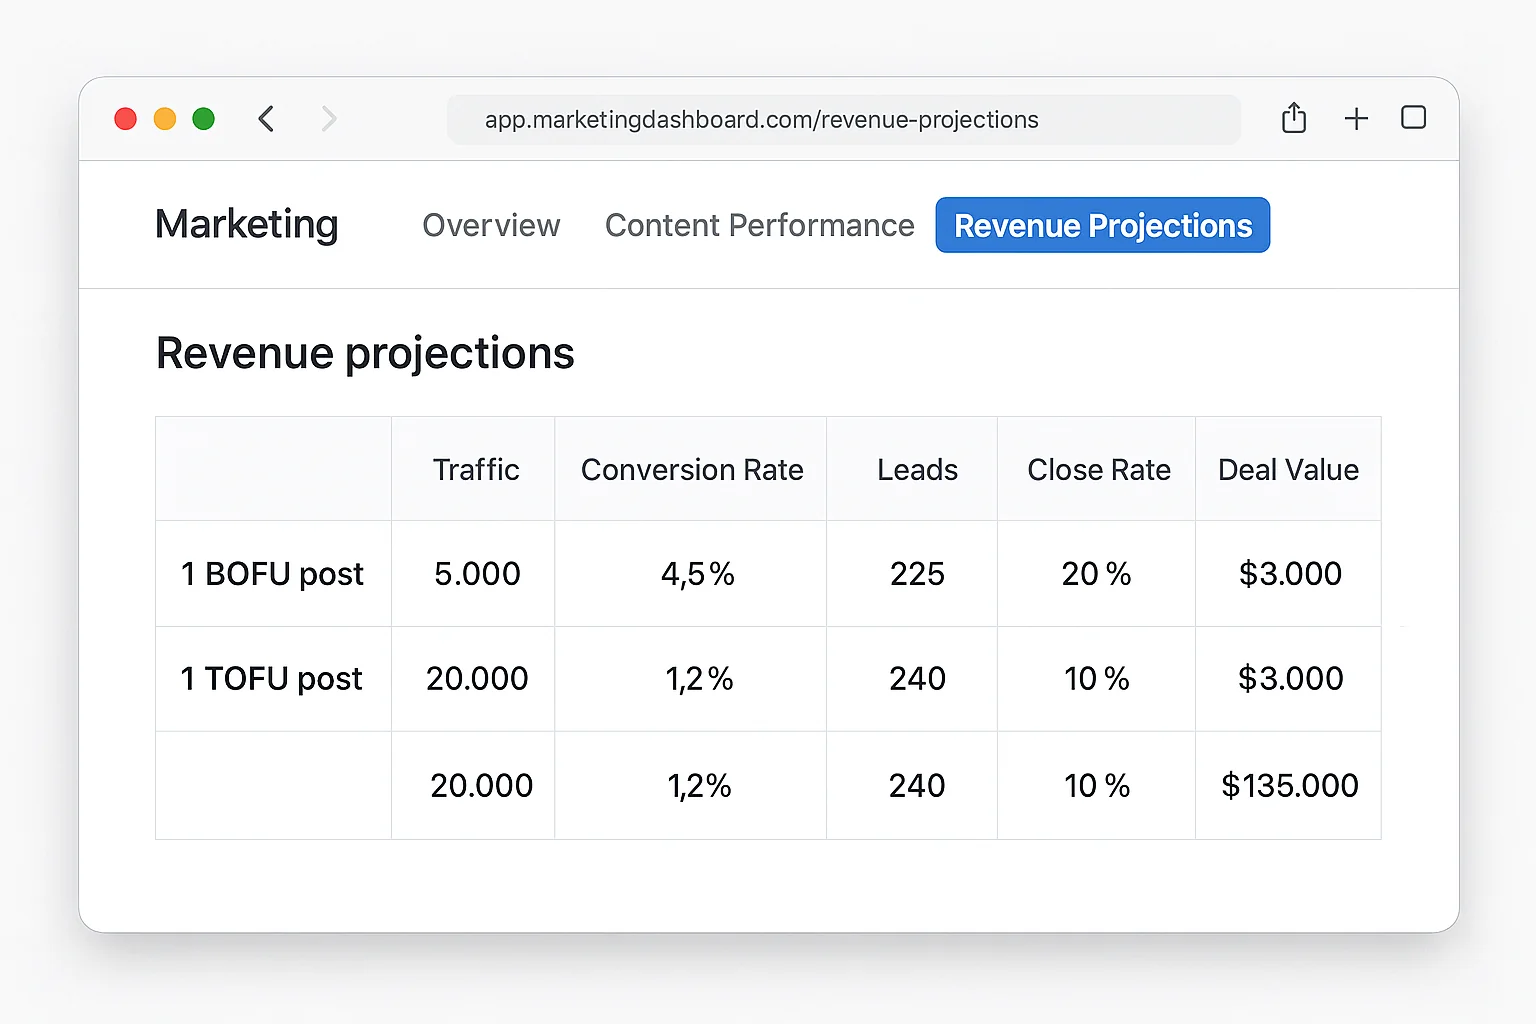
Revenue Per Post Projections: The Math That Changes Everything
This is where the BOFU-first strategy moves from theory to dollars.
Let’s run the numbers on a real scenario. You publish a BOFU blog post targeting “best email marketing platform for ecommerce” (880 monthly searches, according to Ahrefs).
Conservative assumptions:
- You rank on page 1 and capture 5% of monthly search volume = 44 visitors/month
- Your BOFU post converts at 8% = 3.5 leads/month
- Your average deal value is $2,000/year
- Your close rate on BOFU leads is 25%
Revenue from one post: 3.5 leads x 25% close rate x $2,000 = $1,750/month. That is $21,000/year from a single blog post.
Now compare that to a TOFU post targeting “what is email marketing” (22,000 monthly searches).
Same assumptions adjusted for TOFU:
- You rank on page 1 and capture 3% of monthly search volume = 660 visitors/month
- Your TOFU post converts at 1% = 6.6 leads/month
- These leads are early-stage. Close rate drops to 5%
- Same $2,000 deal value
Revenue from the TOFU post: 6.6 leads x 5% close rate x $2,000 = $660/month. That is $7,920/year.
The BOFU post with 44 monthly visitors generates 2.6x more revenue than the TOFU post with 660 monthly visitors.
Factor in effort and it gets worse for TOFU. Ranking for “what is email marketing” requires a 5,000-word definitive guide, dozens of backlinks, and months of effort. Ranking for “best email marketing platform for ecommerce” requires a well-researched comparison post and a fraction of the links.
The Portfolio Effect
Multiply this across 10 BOFU posts, each generating $15,000-25,000 in annual revenue.
A portfolio of 10 well-targeted BOFU posts can drive $150,000-250,000 in annual revenue. That same effort spent on 10 TOFU posts would generate $50,000-80,000 at best.
This is why one BOFU post can generate more revenue than 20 TOFU posts combined. It is not hyperbole. It is the math of conversion rates multiplied by close rates multiplied by deal values.
The takeaway: Run the revenue-per-post calculation before you write anything. A BOFU post targeting 200 searches can outperform a TOFU post targeting 20,000 searches by 2-3x on pure revenue. Let the math drive your editorial calendar.
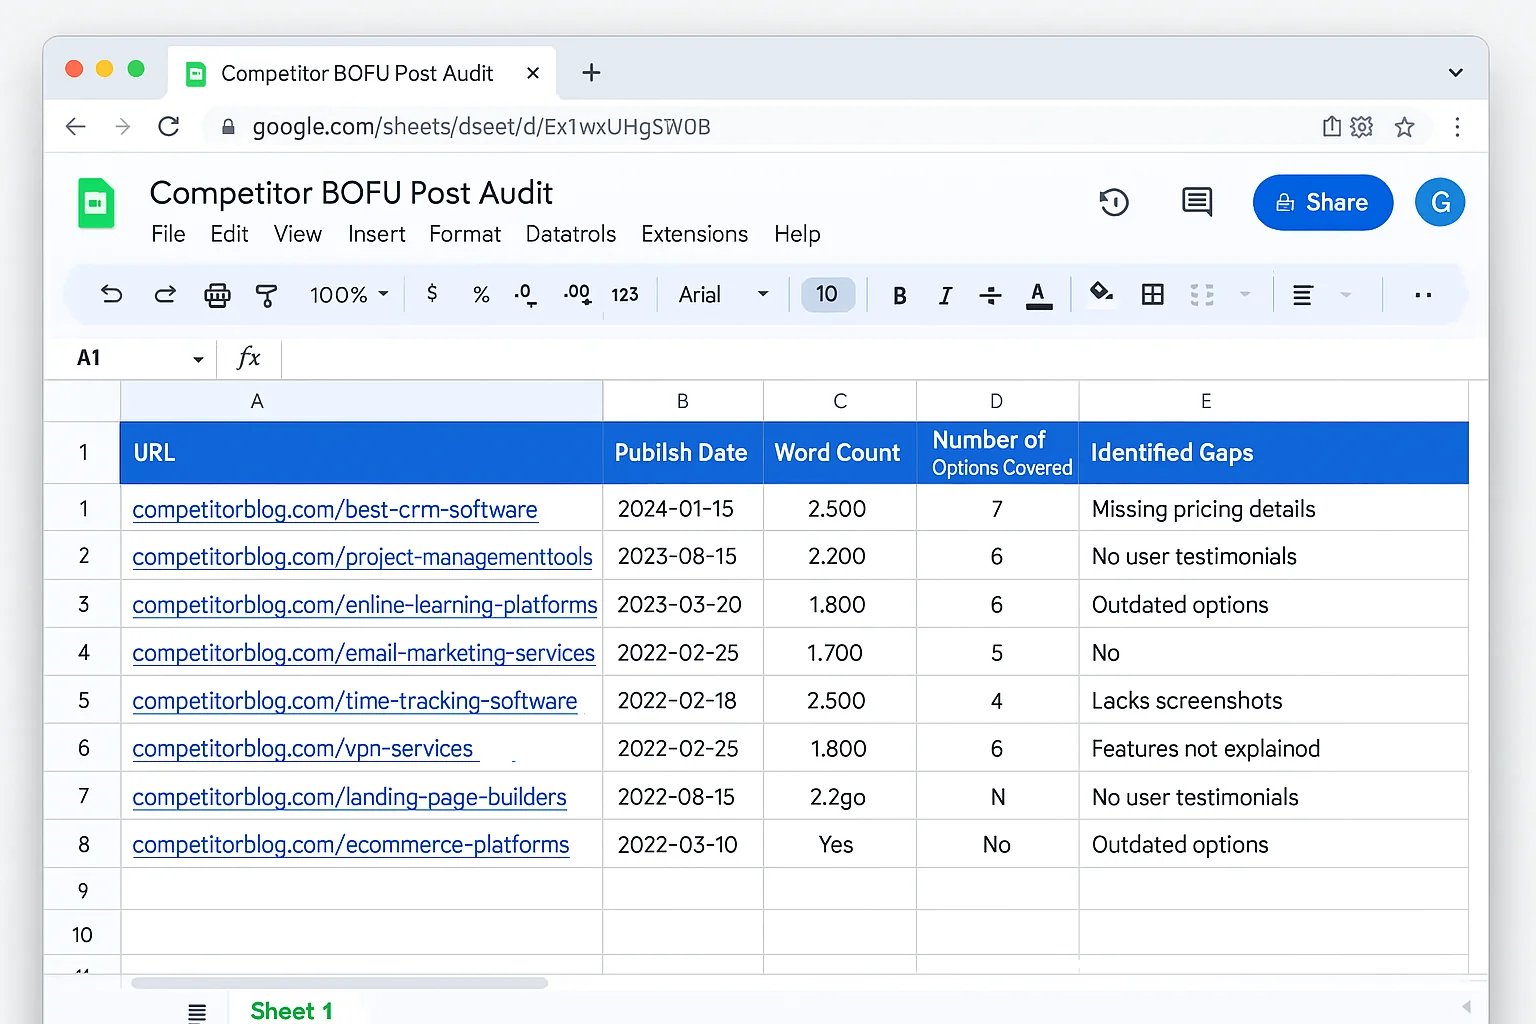
Reverse-Engineer Your Competitors’ BOFU Content in 30 Minutes
Your competitors have already done BOFU content research for you. Find it, analyze it, beat it.
Step 1: Identify Competitor BOFU Pages (5 Minutes)
Go to Ahrefs’ Site Explorer (or SEMrush, or Ubersuggest). Enter your top competitor’s domain. Navigate to Top Pages. Filter for URLs or titles containing “vs,” “compare,” “alternative,” “best,” “pricing,” or “review.” Sort by traffic value, not just traffic.
The top 10-20 results are your competitor’s BOFU content portfolio. These are the pages making them money.
Step 2: Analyze Their Content Gaps (10 Minutes)
Open each competitor BOFU page. Score it on these five criteria:
- Freshness: Is the data from 2024 or earlier? Outdated pricing and old screenshots are openings you can exploit.
- Depth: Do they cover every meaningful option, or did they skip 2-3 viable alternatives?
- Specificity: Do they give a clear recommendation, or do they hedge without ever committing?
- Bias: Are they reviewing their own product against competitors? Readers spot this instantly.
- Format: Is it scannable with comparison tables and clear verdicts, or a wall of text?
Most competitor BOFU content fails on at least 2-3 of these. That is your opening.
Step 3: Build a Better Version (15 Minutes of Planning)
For each competitor page you want to beat, outline your post with these advantages:
- Updated data. Current pricing, current features, current screenshots. If their post references 2024 pricing, you win on freshness alone.
- Additional options. They covered 5 alternatives? You cover 7, including the 2 they missed.
- Clear verdict. “For ecommerce stores under $1M in revenue, [Tool X] is the best option because…” Readers crave decisive recommendations.
- Comparison table. Side-by-side feature and pricing comparisons in a scannable table.
- Use-case segmentation. “Best for small teams,” “best for enterprise,” “best for budget-conscious buyers.” Segment by use case and you capture more BOFU keywords simultaneously.
The takeaway: Your competitors have validated which BOFU topics generate traffic and revenue. Find their BOFU pages, identify their weaknesses, and build a demonstrably better version.
Why BOFU Content Wins on Every Metric That Matters
BOFU content does not just convert better. It outperforms TOFU across nearly every metric content teams care about.
Higher conversion rate. 5-15% vs 0.5-2%. This alone justifies the strategy shift.
Shorter sales cycle. BOFU leads have already identified their problem and narrowed to specific options. The distance between “reading your comparison post” and “signing up for a demo” is days, not months.
Lower cost per acquisition. BOFU keywords have lower competition, fewer backlinks needed to rank, and lower content production costs per ranked page. You spend less to acquire a lead that is worth more.
Better lead quality. Sales teams LOVE BOFU leads. A lead who found you through “best CRM for real estate agents” has context, intent, and urgency. A lead who found you through “what is a CRM” needs 6 months of nurturing before they are ready for a conversation.
Faster ROI. A BOFU post can start generating revenue within weeks of ranking. A TOFU post needs nurturing emails, middle-of-funnel content, and retargeting infrastructure to ever produce revenue.
According to HubSpot’s marketing benchmarks, companies that align content to the buyer’s journey see 72% higher conversion rates. BOFU content is the most aligned content you can produce because it matches the moment of decision.
The takeaway: BOFU content wins on conversion rate, sales cycle length, cost per acquisition, lead quality, and time to ROI. Traffic without conversion is a vanity metric.
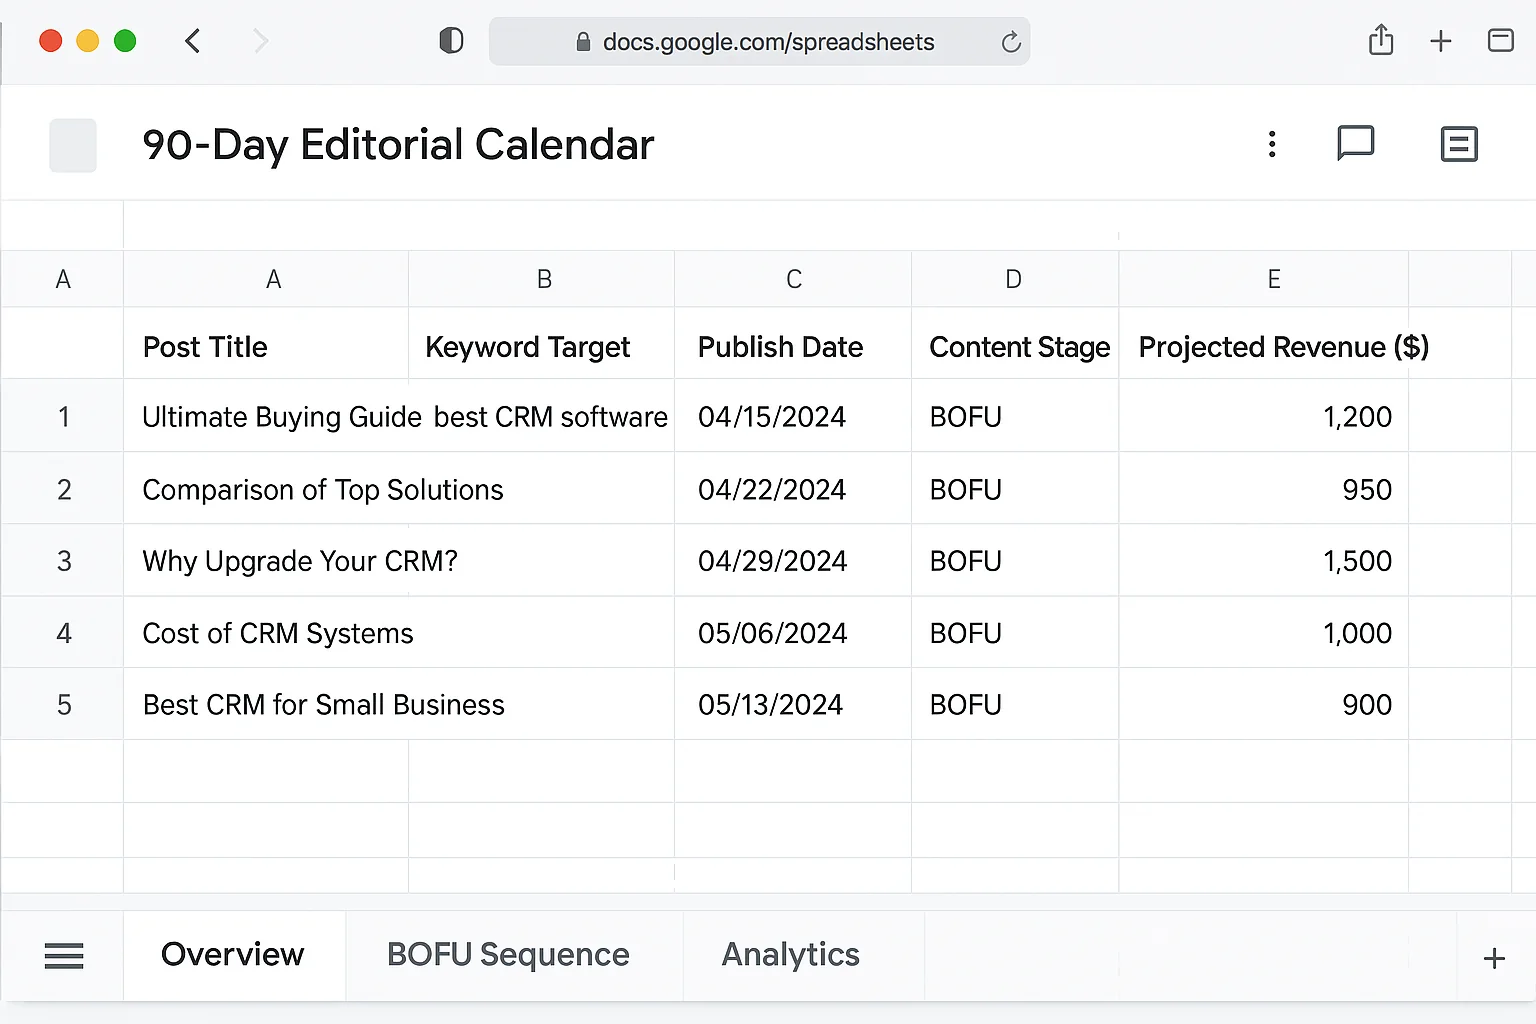
Your First 5 BOFU Posts: The 90-Day Action Plan
Stop planning. Start publishing. Here is the exact sequence for your first 90 days of BOFU content.
Week 1-2: Keyword Research and Competitor Audit
- Use the 4 keyword patterns to generate 20-30 BOFU keyword ideas in your niche
- Run revenue-per-post projections on each keyword (traffic estimate x conversion rate x deal value)
- Rank the keywords by projected revenue. Pick the top 5
- Audit the top 3 ranking pages for each keyword using the competitor analysis framework above
Week 3-4: Publish Post #1 (Your Best Comparison Post)
Start with a “[Tool A] vs [Tool B]” post. The structure is obvious: introduce both tools, compare features, compare pricing, give a verdict. Include a comparison table. State a clear recommendation. Publish.
Week 5-6: Publish Post #2 (Your Best “Best For” Roundup)
Write your “best [tool] for [use case]” post. Cover 5-7 options. Segment by use case. End each entry with a one-sentence verdict.
Week 7-8: Publish Post #3 (A Pricing Breakdown)
Target a “[tool] pricing” keyword. Break down every plan, every tier, every hidden cost. Readers searching for pricing want COMPLETENESS.
Week 9-10: Publish Posts #4 and #5
Pick from your remaining top-5 keywords. Vary the format to capture different BOFU keyword patterns.
Week 11-12: Measure and Double Down
Check your Google Search Console data. Which posts are indexing? Which are generating clicks? If any post is ranking on page 2, add 500 words of depth or build 2-3 backlinks to push it onto page 1.
After 90 days, you have 5 BOFU posts live. Those 5 posts should be generating 10-20 qualified leads per month within 6 months of indexing. At a $2,000 average deal value and 25% close rate, that is $5,000-10,000 per month in content-attributed revenue from just 5 posts.
That is more revenue than most blogs generate from 50+ TOFU posts over the same period.
The takeaway: Five BOFU posts in 90 days. Use the keyword patterns, run the revenue projections, audit competitors, and publish one post every two weeks. The math works. The framework works. The only variable is execution.
Most content strategy advice is written for media companies that monetize through ad impressions. If you monetize through leads, sales, or services, that model is broken.
Traffic is not the goal. Revenue is the goal. The shortest path from blog post to revenue runs through bottom-of-funnel content.
Start at the bottom. Build the conversion layer first. Then add traffic on top of an engine that already knows how to turn visitors into money.
Go publish your first BOFU post this week. The revenue math is waiting.